Article
GQS Case Study: The Details Net Hundreds Of Thousands In Extra Tax Depreciation
June 15, 2021
Article written by Zac Gleeson, Director
What is the difference between farm depreciation reports completed by two different companies?
It is all in the detail.
When you look at the finished product (the report), there are two parts to it. The inspection component (gathering data about the infrastructure assets) and the Valuation component undertaken by a Quantity Surveyor (where the QS takes the collected data and applies a value to each improvement or asset for the report).
Let’s look at the inspection side first. Inspector A may already be doing a valuation on your farm, they capture the usual photos of all the main sheds and yards. Quick, easy and they can do the report cheap for you. Then there’s inspector B, not only do they take a note of the outside of the sheds, but in their report they are breaking down the structure, the type of floor, type of lighting, how many lights and does it have 3 phase? In the shearing shed they even note the grating, wool bins, wool table etc. Inspector B is also keen to look at the different types of fencing, the pump sheds and that old hay shed out the back. In the end, inspector B has captured the whole property in detail including the kitchen sink.
The inspectors then hand their reports over to the QS. Now the QS for inspector A lives in the city, does a few farms a year and conservatively puts a value on the assets to reduce their liability on something they are not all that experienced at and completes the report.
Inspector B, hands over his report to the QS, who’s family is off the land and he specialises in rural depreciation reports, he does 1000’s of these a year. He has put together an extensive database of values for every type of rural infrastructure, no matter the age and condition. Due to the detailed report that inspector B has been able to provide, his QS is comfortable to apply the maximum value to each asset that reflects the age, condition and make-up of that asset.
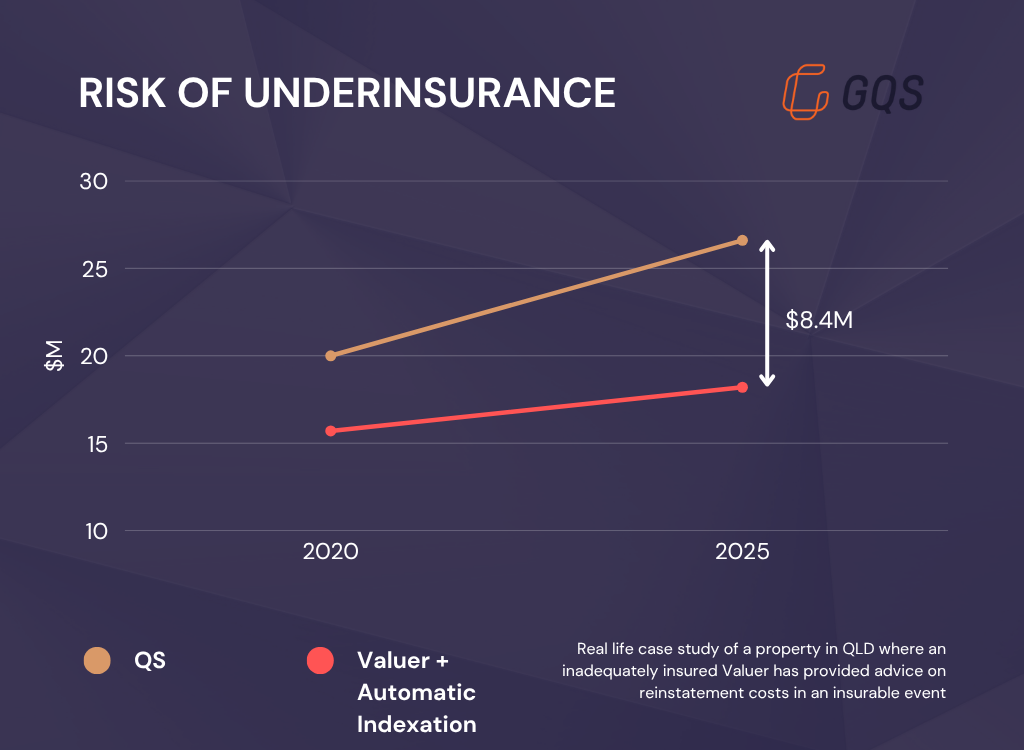
So what’s the difference then? In one instance last year it was worth $350,000 to our client. A valuer, who had done a valuation on a property for our client had provided the report to his QS and the QS estimated that there would be $100k in depreciation. Having not seen the property, we had the client complete our checklist to ascertain the assets on the farm and then compared it with similar farms in our data-set. We estimated that there would be $250-350k in potential depreciation. The cost of our report was $1,000 more than the valuer but the client engaged us. After we completed out extensive inspection and report our client ended up with $450k in depreciation. ‘An extra $1,000 in fees generated a further $350k in tax deductions’.
Have any questions? Call us at 1300 290 235